
Articles Mar 1, 2026 9:00:00 AM Seth Mattison 21 min read

Collaborative innovation thrives when you measure its impact effectively. To ensure success, focus on defining clear KPIs, leveraging advanced analytics tools, and maintaining a structured feedback process. Here's a quick breakdown:
- Define KPIs: Align metrics with goals, combining input, process, output, and outcome indicators. Examples include participation rates, idea submission ratios, and revenue from new products.
- Use Analytics Tools: Platforms like Wazoku and AEVO Innovate streamline data collection and analysis, offering insights like time-to-market and ROI.
- Monitor Progress: Regularly review metrics and involve stakeholders in decision-making. Use visual dashboards and frameworks like "Kill, Pivot, or Scale" to guide actions.
- Combine Metrics: Pair quantitative data (e.g., cost savings, patents filed) with qualitative insights (e.g., team feedback, collaboration quality).
- Refine Continuously: Identify trends, adjust processes, and update KPIs to improve outcomes.
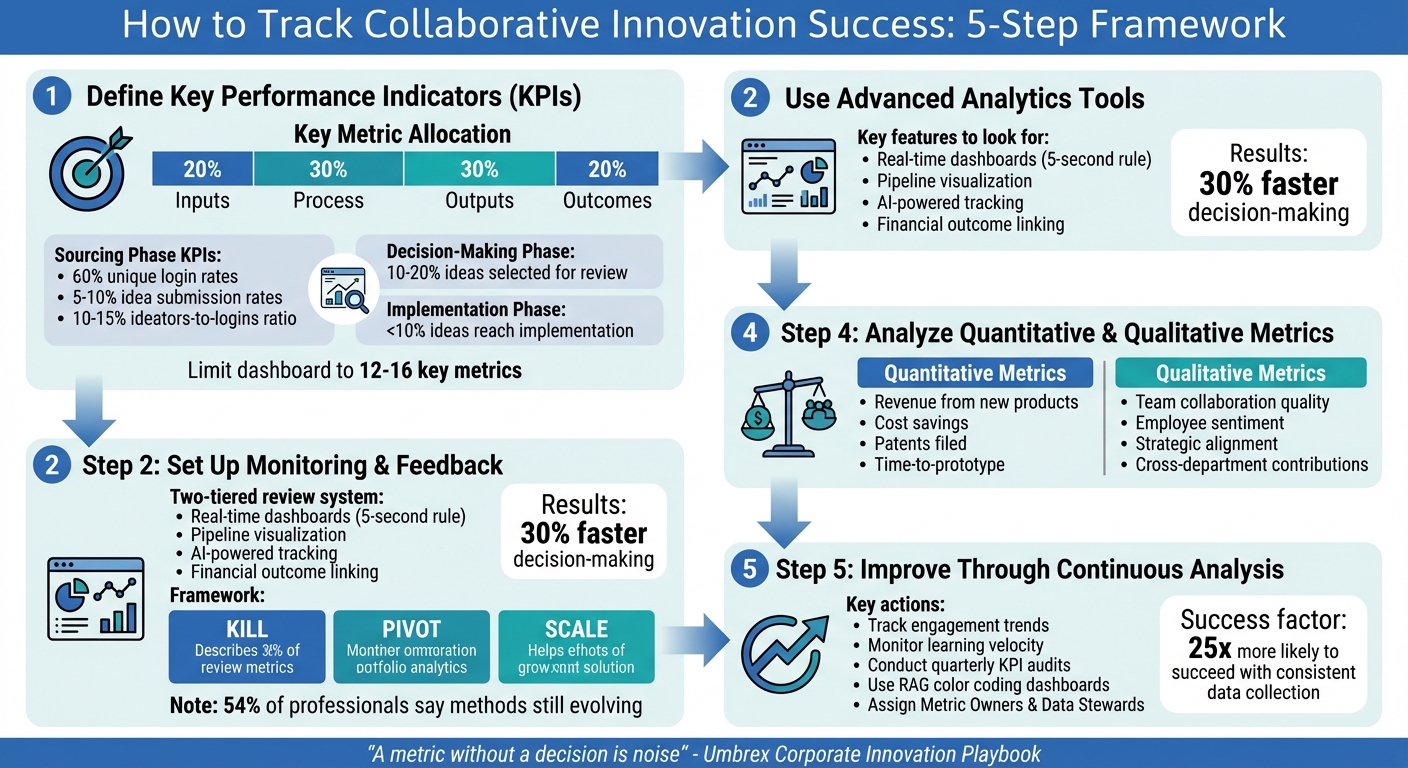
5-Step Framework for Tracking Collaborative Innovation Success with Key Metrics
Step 1: Define Key Performance Indicators (KPIs)
Start by identifying KPIs that align directly with your strategic goals. As the Umbrex Corporate Innovation Playbook wisely states:
"A metric without a decision is noise" [9].
Each KPI should serve a purpose - answering specific management questions and guiding how resources are allocated.
To create a balanced approach, combine leading indicators (like experiment velocity or participation rates) with lagging indicators (such as revenue from new products). A typical innovation framework might allocate weight as follows: 20% to inputs, 30% to process, 30% to outputs, and 20% to outcomes [9]. This balance ensures you avoid "vanity metrics" that may seem impressive but offer little strategic value. With this foundation, you can define KPIs tailored to each phase of innovation.
KPIs for the Sourcing Phase
In the sourcing phase, the focus is on engagement and diversity of ideas. Key metrics to track include:
- Unique login rates: Aim for 60% participation [1].
- Idea submission rates: Target 5–10% of employees submitting ideas quarterly [6].
- Ideators-to-logins ratio: Strive for 10–15% [1].
Additionally, measure collaboration by tracking the number of comments and the diversity of departments involved.
For instance, in October 2025, Sicoob Credicom leveraged the AEVO Innovate platform to achieve an 81% employee engagement rate. This led to nearly $5 million in measurable impact, including $2.3 million in revenue growth and $2.1 million in cost savings [6]. These results highlight how well-chosen KPIs during sourcing can predict long-term success.
KPIs for the Decision-Making Phase
During decision-making, focus on efficiency and quality. Key metrics include:
- Percentage of ideas selected for further review: Target 10–20% of all submissions [6].
- Evaluation turnaround time: Measure how quickly ideas are reviewed.
- Percentage of ideas sent back for iteration: Track feedback loops.
Strategic alignment scores are particularly critical, ensuring innovation efforts tie back to core business objectives. Monitoring "kill rates" for ideas and products can also be insightful - a non-zero kill rate often reflects healthy resource management and prioritization [3].
KPIs for the Implementation Phase
Implementation is often where the biggest bottlenecks occur, with fewer than 10% of submitted ideas typically reaching this stage [6]. Focus on execution metrics like:
- Number of experiments per idea: Gauge how thoroughly ideas are tested.
- Time-to-market: Compare actual timelines to planned launch dates.
- Innovation Vitality Index: Measure the percentage of revenue from products launched in the past three years [6][9].
For example, in October 2025, Aeris Energy used well-defined KPIs to achieve a 6.8x return on investment and save $700,000 annually [6]. Similarly, NASA's Wazoku Crowd platform challenge generated 82 months' worth of work in just 45 days, showcasing how implementation speed can be quantified and improved [8].
To avoid overwhelming your team, keep your dashboard focused - limit it to 12–16 key metrics, with three to four per strategic perspective [9]. A "Metric Dictionary" can also help standardize terms like "validated idea" or "implementation", ensuring everyone is on the same page.
Step 2: Use Tools with Advanced Analytics
Once your KPIs are set, it's time to bring in advanced analytics tools. Relying on manual spreadsheets can lead to errors and inefficiencies, especially as your data grows. Modern innovation management platforms step in to simplify this process, turning scattered information into a centralized hub. This allows for faster, smarter decisions based on real evidence [10][11].
These tools do more than just gather data - they uncover actionable insights. Take, for example, Nissan's Sunderland plant. In 2025, they used the Wazoku platform to pinpoint cost-saving opportunities and inefficiencies in their processes. The result? Verified savings of over £5 million (around $6.3 million) in just one year. Similarly, HSBC adopted Wazoku for its innovation program, and by early 2026, they reported benefits exceeding £100 million (about $126 million) [14]. This shows how these platforms not only organize data but also provide a clear path to impactful outcomes.
Features to Look for in Tools
When choosing an analytics platform, look for features that make data easy to understand and act on. Real-time dashboards are a must, especially ones that follow the "5-second rule" - leaders should be able to quickly assess the health of their portfolio through clear visualizations and logical groupings [13]. The tool should also track metrics like unique logins, idea comments, and contributor diversity [1][4]. Pipeline visualization is another essential feature, helping you monitor how ideas move through different stages and identify bottlenecks [10][5].
The best platforms go a step further by linking innovation efforts to measurable financial outcomes, such as cost reductions or revenue from new products [4][13]. Many also incorporate AI capabilities, offering automated KPI tracking, trend analysis, and early alerts for underperforming initiatives [10][12]. As Peter Mork, Corporate Innovation Liaison at Noblis, put it:
"Wazoku Platform meshed with the technologies people in our corporation were already using. The fact that the tools we know how to use could be directly embedded with the platform directly drove up the visibility of ideas" [14].
Examples of Metrics Tracked by Tools
These platforms deliver real value by improving key metrics. For process efficiency, they can track collaboration time (how long it takes to go from submission to implementation), iteration rates (how many experiments are conducted before a final decision), and idea conversion rates (the percentage of ideas that progress through stages) [10][12]. For gauging workplace engagement, metrics like unique logins, active contributors per campaign, and sentiment analysis can reveal how employees feel about specific challenges [1][15].
Organizations using these tools often report faster decision-making - sometimes 30% quicker - and higher implementation rates compared to manual methods [12]. The trick is to avoid cluttering dashboards with too much data. Focus on the metrics that truly matter for governance, rather than overwhelming users with unnecessary details [11].
Step 3: Set Up a Monitoring and Feedback Process
Once you've deployed advanced analytics, the next step is to ensure that data leads to action. This means creating a structured process for monitoring progress and gathering feedback from all involved. Without consistent oversight, even the best analytics tools can end up as repositories of unused data. A well-organized monitoring system ensures that your innovation efforts stay aligned with organizational goals and that promising ideas don’t lose momentum.
Regular Check-ins with Key Stakeholders
To keep your analytics framework effective, schedule regular check-ins with key stakeholders. These meetings help maintain alignment with your strategic objectives. A two-tiered review system works well: monthly sessions focus on operational metrics like experiment speed, bottlenecks, and team-level trends, while quarterly reviews take a broader look at portfolio health, resource allocation, and alignment with company-wide goals [9][12]. This combination allows you to address small issues early while keeping an eye on long-term strategies.
An advisory board, made up of campaign sponsors and program leaders, plays a critical role in these reviews. Their involvement ensures that projects stay connected to your strategic vision rather than veering off into easier, but less impactful, initiatives [2]. During these meetings, consider using a "Kill, Pivot, or Scale" framework. This approach helps you make data-driven decisions - halting projects with low success rates, adjusting those with potential, and doubling down on initiatives that show strong results [12]. This ensures that the insights from your analytics tools directly influence your strategic direction.
Collecting Feedback for Improvement
While data provides valuable insights, it often lacks the full picture. Qualitative feedback from participants helps fill in the gaps. Surveys can gauge whether challenge questions resonate with participants and whether they feel empowered to contribute ideas [2]. This type of feedback builds trust and keeps engagement levels high. In fact, 54% of innovation professionals admit their measurement methods are still evolving, making community input essential for refining processes [16].
To further enhance learning, implement tools like learning logs. These allow teams to document unexpected outcomes - whether it’s a failed experiment, surprising customer feedback, or flawed assumptions. These narratives add context that raw data alone can’t provide [9]. Additionally, set up automated alerts through platforms like Slack or email to flag metrics that fall outside healthy ranges. This enables quick action before formal review meetings [9][12]. Finally, maintain a shared "KPI Library" or metric dictionary to standardize definitions across teams, ensuring everyone interprets the data consistently [9].
Step 4: Analyze Quantitative and Qualitative Metrics
Once you've set up a solid system for monitoring and gathering feedback, the next step is to dive into the data. This means looking at both the numbers and the stories behind them. Quantitative data shows you what’s happening, while qualitative insights help you understand why. Focusing only on financial metrics can leave you in the dark about important factors like team dynamics, strategic alignment, or the real-world value your innovations bring to users. By combining these two types of data, you get a fuller picture of performance and progress [16].
Quantitative Metrics and Their Impact
Quantitative metrics provide measurable proof of progress. For example:
- Revenue from new products (typically those launched in the last three years) shows whether your innovation is paying off in the market.
- Cost savings from process improvements highlight efficiency gains.
- Patents filed reflect the strength of your intellectual property pipeline [18][12].
Beyond these, process metrics like experimentation velocity and time-to-prototype reveal how quickly your teams move from brainstorming to testing ideas [18][12].
To make sense of it all, organize metrics into four categories: inputs, processes, outputs, and outcomes [9].
- Input metrics measure resources, such as funding or the number of dedicated team members.
- Process metrics track how smoothly and quickly work flows.
- Output metrics count deliverables, like prototypes or validated concepts.
- Outcome metrics focus on realized value, like incremental revenue or Return on Innovation Capital.
This balanced approach helps avoid "outcome obsession", where focusing too much on revenue can stifle early-stage projects that need time to grow [9].
Qualitative Metrics for Deeper Insights
Metrics alone don’t tell the whole story. Qualitative data - like team collaboration quality, employee sentiment, and strategic alignment - offers a window into the health of your innovation culture [17][18]. These insights are especially crucial for early-stage projects, where financial data may not yet exist [19][20].
For instance, tracking how many departments contribute to a project can reveal whether your teams are genuinely collaborating and drawing from diverse perspectives [1].
"Pair quantitative metrics (e.g., ROI, time-to-market) with qualitative narratives (e.g., a successful product launch story) to make data compelling and relatable." - Alison Ipswich, Traction Technology [18]
Surveys can also help gauge how well employees connect with challenge questions or assess the quality of their collaborations [2][18]. Additionally, monitoring "system health" factors - like leadership involvement, role alignment, and how well knowledge flows across teams - can provide early warnings of trouble. Delayed stage-gates or frequent project restarts, for example, might signal deeper issues before financial losses become obvious [12].
Step 5: Improve Through Continuous Analysis
Tracking metrics is just the start; the real magic happens when you use that data to fine-tune your innovation process. Companies that thrive in innovation are 25 times more likely to succeed because they focus on consistent data collection and apply those insights at every stage [21]. This involves regularly reviewing your metrics, identifying patterns, and tweaking workflows based on what the numbers tell you. By doing this, you can refine your KPIs and analytics tools, strengthening the feedback loop from earlier steps.
Using Data to Identify Trends
Data isn’t just numbers - it’s a story waiting to be told. Look for patterns that reveal whether your innovation efforts are gaining momentum or hitting roadblocks. For instance, track engagement trends by analyzing login activity over time. A steady increase in repeat logins suggests your program is resonating with teams and covering topics they care about [1]. Another key metric is learning velocity, or how quickly teams validate or disprove assumptions. As Jeff Rosenbaugh, Senior Director of Professional Services at Lucid, explains:
"In the innovation space, one of our primary jobs is to reduce uncertainty with new products and services. Your metrics should show what you've done this month to reduce uncertainty." [20]
Keep an eye on stage-gate pass-through rates and "Idea-to-Assessment" cycle times to spot bottlenecks [9][5]. For example, if your validation rate drops below 20% after three sprints, it’s a clear signal to either pivot or shut down the project [12]. These insights help you refine processes for better results.
Refining Processes for Better Outcomes
Once you’ve identified trends and gaps, it’s time to act. Conduct quarterly audits to update KPIs and assign clear accountability for each metric [12][9]. Every KPI should have a designated "Metric Owner" who oversees performance and a "Data Steward" who ensures the data is accurate [9].
To make insights actionable, use visual dashboards with Red-Amber-Green (RAG) color coding. This allows executives to quickly identify areas that need attention or celebrate wins [9]. When rolling out new tracking methods, start small - pilot them with one team to iron out any issues before scaling across the organization [12]. Most importantly, tie every metric to a specific decision - whether to kill, pivot, or scale a project - so your data drives action, not just reports [12][9].
Conclusion and Key Takeaways
Steps to Track Success
Measuring the success of collaborative innovation doesn't have to be complicated. Start by defining clear KPIs that align with your overall strategy. Use advanced analytics tools to gain real-time insights and implement structured monitoring systems that include stakeholder feedback. A mix of quantitative and qualitative metrics ensures a balanced approach, while continuous refinement keeps your process adaptable. Visual dashboards, like those with Red-Amber-Green (RAG) color coding, can help executives quickly spot problem areas [9]. Additionally, frameworks like "Kill, Pivot, or Scale" guide data-driven decisions on project direction [12]. Every metric should serve a specific management purpose and have an assigned owner accountable for its performance [9]. These steps not only help measure progress but also create a solid foundation for ongoing innovation.
Thoughts on Collaborative Innovation
A strong innovation measurement framework can turn great ideas into tangible results. Each step in the process builds toward a dynamic system that fosters impactful innovation. The focus of measurement should always be on solving specific challenges within the organization, as highlighted by Anders Richtnér from the Stockholm School of Economics:
"The crux of effective innovation measurement is to understand the problem that measurement should solve for the organization and... to design and implement a useful and usable innovation measurement framework." [7]
Interestingly, more than half of innovation professionals admit their measurement strategies are still evolving [16]. This ongoing refinement is a natural part of the process. By shifting innovation from a spontaneous effort to a structured discipline, you can transform ideas into learning, learning into products, and products into sustainable growth [9]. When done correctly, tracking doesn't just measure success - it creates the conditions for achieving it.
FAQs
Which KPIs matter most for my innovation program?
The success of your innovation program hinges on tracking the right metrics, which should align with your specific goals. While these can vary, some common indicators include idea quality, process efficiency, collaboration, and measurable results. Here's a closer look:
- Idea Pipeline: Tracks the number of ideas submitted, their quality, and how many are implemented. This gives insight into the strength and productivity of your idea-generation process.
- Time to Market: Measures how quickly concepts move from initial idea to launch, highlighting the efficiency of your development cycle.
- Collaboration: Focuses on the diversity and engagement of contributors, ensuring a mix of perspectives and active participation.
- Business Impact: Evaluates tangible outcomes such as cost savings, revenue growth, or other measurable benefits stemming from the program.
By monitoring these metrics, you can assess performance and make informed adjustments to drive better results.
How do I prove ROI from collaborative innovation?
Tracking the return on investment (ROI) from collaborative innovation means focusing on metrics that clearly show its value. Start with financial results, like revenue generated from new ideas or cost reductions. Then, look at engagement levels, which include how actively employees and partners participate. Another key area is strategic alignment, ensuring the outcomes support your organization's broader goals.
You can also measure things like time savings or the advantages of new ideas compared to existing practices. These metrics help you capture both the obvious, measurable benefits and the harder-to-quantify ones. To get the most accurate picture, make sure your measurements align closely with the specifics of your initiatives.
How often should we review and update our KPIs?
Reviewing your KPIs on a regular basis is crucial to keeping them aligned with your objectives and ensuring they remain effective. Experts recommend doing this at least once every quarter. This frequency gives you the flexibility to adjust to shifting priorities, refine strategies, or even decide whether to scale up, shift direction, or pause certain projects. Regular check-ins also foster better teamwork and productivity by addressing evolving project requirements and team dynamics head-on.