
Articles Jul 6, 2026 8:48:43 PM Seth Mattison 20 min read
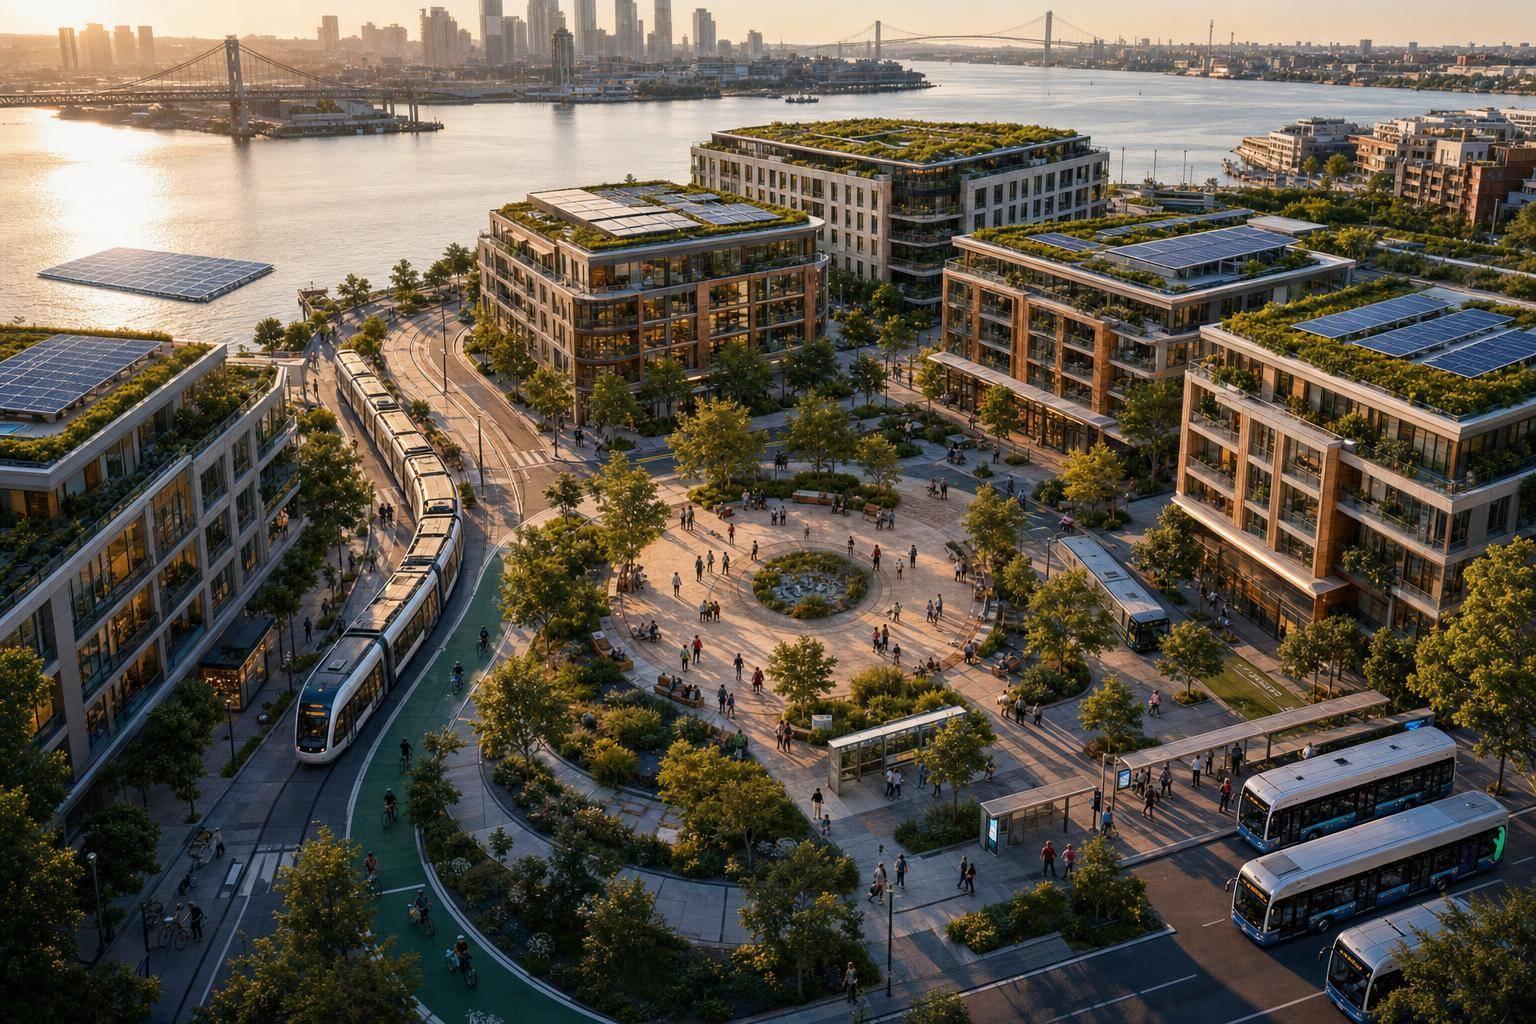
The main point is simple: in 2026, the hubs pulling ahead are the ones that turn climate goals into built projects, working systems, and better living conditions. I see three themes show up again and again: district decarbonization, circular design, and social resilience.
If I had to boil the article down fast, it would be this:
- Execution beats pledges. Fewer than 30% of city plans reviewed in 2025 had funding in place.
- Buildings and transport matter most. Buildings drive 37% of energy-related CO2 emissions, and transport adds 23%.
- Data quality matters. Only about 40% of 1,300+ cities reporting to CDP use the same GHG method, which makes city-to-city comparison shaky.
- Top hubs attract more deal flow. Markets in the top half of innovation scores see 3.3x more sales activity than lower-ranked markets.
- Older buildings are a bottleneck. Just 11% of global office stock was built after 2020.
- Emerging hubs face a funding gap. Least-developed countries received only 4% of global urban climate finance in 2024.
What stands out to me is how the regional playbook differs. North America ties climate action to asset value and business growth. Europe leans on building rules and retrofit pressure. Asia-Pacific moves through large infrastructure systems like district cooling, electric transit, and digital twins. Latin America, Africa, and the Middle East are trying to cut emissions while still building core city systems.
A few examples make that clear:
- Copenhagen: 22% of patents are green patents.
- Barcelona: Superblocks cut NO2 by 25% and lifted property values by 6% to 9%.
- Singapore: Jurong Lake District targets 30% lower carbon intensity with 100% green-certified buildings.
- Shenzhen: More than 16,000 electric buses and 22,000 electric taxis.
- Medellín: Green corridors lowered temperatures by 2 to 3°C (3.6 to 5.4°F).
- Dubai: Solar park target of 5,000 MW by 2030.
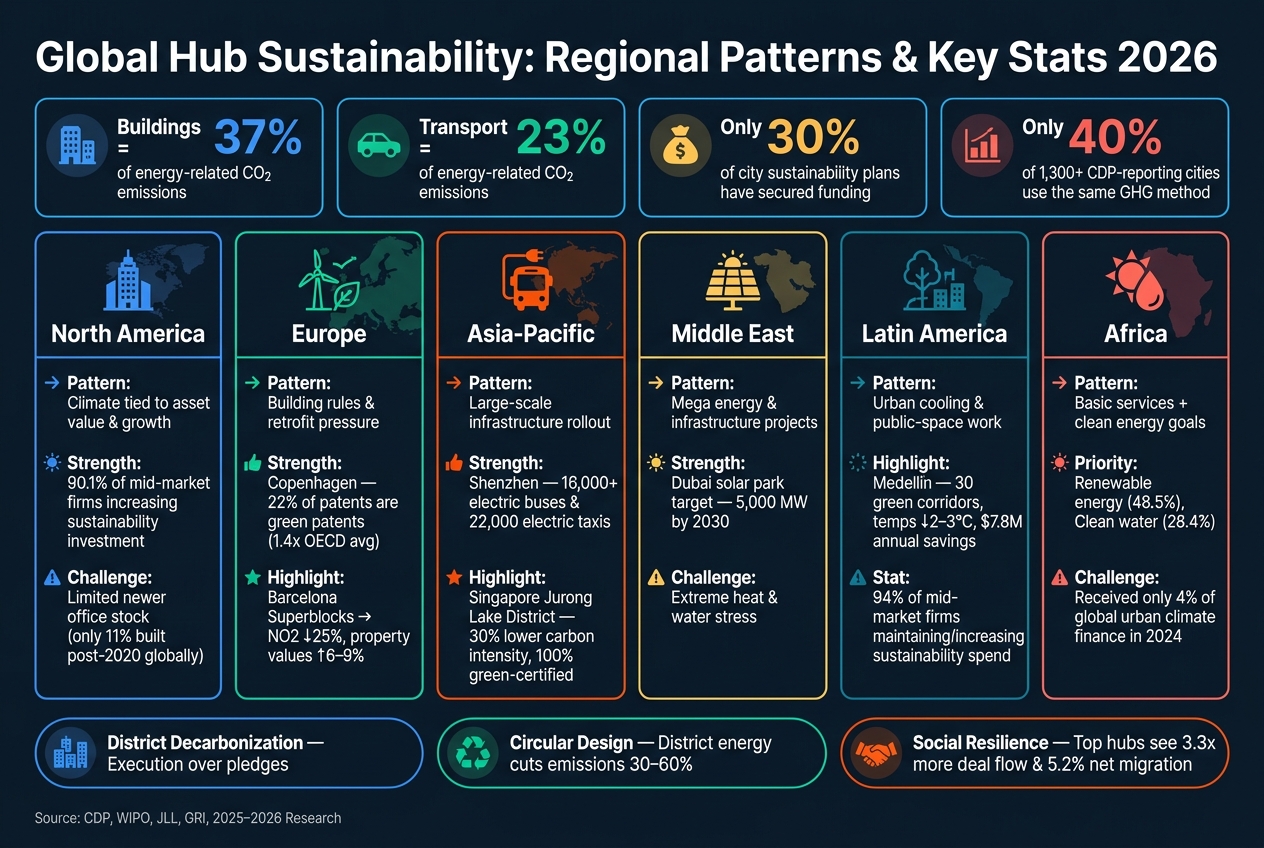
Global Hub Sustainability: Regional Patterns & Key Stats 2026
When bold cities collaborate: Accelerating climate neutrality together
sbb-itb-9ceb23a
Quick Comparison
| Region | Main pattern I see | Common strength | Main issue |
|---|---|---|---|
| North America | Climate tied to growth and property value | High private-sector spending | Limited supply of newer office space |
| Europe | Building rules and retrofit push | Lower-energy districts, green patents | Cost and pace of retrofits |
| Asia-Pacific | Large-scale infrastructure rollout | Electric transit, district systems, digital planning | Heavy energy demand |
| Middle East | Big energy and infrastructure projects | Solar build-out | Heat and water stress |
| Latin America | Urban cooling and public-space work | Nature-based city projects | Funding and delivery pace |
| Africa | Basic service needs plus clean energy goals | Renewable energy focus | Very low climate finance share |
For me, the article’s bottom line is not about who has the best slogan. It’s about who can show proof: emissions moving down, buildings getting upgraded, transport systems changing, and local people seeing gains too. That is what now shapes site selection, investment, and hiring.
Regional Patterns: Which Global Hubs Are Leading on Sustainability
Global hubs are moving in the same direction on sustainability, but they’re not all dealing with the same bottlenecks. North America and Europe are moving through policy and property. Asia-Pacific is pushing through large-scale infrastructure. Emerging hubs are still working on core systems while trying to cut emissions at the same time.
North America and Europe: Net-Zero Districts, Green Buildings, and Circular Urban Policy
In North America, sustainability is often treated as a business issue tied to growth and asset value. The Bay Area, New York City, Boston, Miami, and Phoenix show up most often in 2026 research. Firms in the region most often point to renewable energy integration (45.7%), diversity, equity, and inclusion initiatives (42.1%), and waste reduction (40.9%). And 90.1% of mid-market firms in North America plan to maintain or increase sustainability investment in 2026. [5]
Europe is taking a different path. Cities like London, Paris, Amsterdam, Copenhagen, and Berlin are using regulatory pressure - especially around building efficiency - to push lower-energy buildings and district retrofits. Copenhagen stands out in particular: 22% of all patents filed in the Greater Copenhagen area are classified as green patents, which is 1.4 times the OECD average. [7]
Barcelona’s Superblocks program shows what this looks like on the ground. In a 2025 review of 21 completed Superblocks, NO2 concentrations fell by 25%, surface temperatures dropped by 1.4°C (2.5°F), and property values increased by 6–9%. The city plans to expand the model to 503 superblocks by 2030. In Europe, sustainability is often tied to lower operating costs and cheaper capital. [5][7][8]
Asia-Pacific puts less weight on regulation and more on direct control over infrastructure at scale.
Asia-Pacific: Smart Infrastructure, Water Systems, and Data-Led Urban Sustainability
Asia-Pacific stands out for scale and digital systems. In Singapore, Jurong Lake District is being built as the country’s first car-light district, with a district cooling network and 100% green-certified buildings. It is projected to operate at 30% lower carbon intensity than conventional districts. [7][8]
Shenzhen has gone even further on transport. Its public transit fleet includes more than 16,000 electric buses and 22,000 electric taxis, making it a fully electric bus and taxi fleet. [7][8]
At the cluster level, the Shenzhen–Hong Kong–Guangzhou innovation corridor ranks No. 1 globally in WIPO’s 2025 rankings, followed by Tokyo–Yokohama and San Jose–San Francisco. Across Asia-Pacific, digitalization is the top sustainability focus, cited by 37.0% of firms. At the same time, more than 30 cities globally are now piloting digital twins to model how urban changes could affect energy use and flood risk before money gets committed. [5][6][8]
Emerging hubs are dealing with a tougher balancing act: building out core infrastructure while trying to move on sustainability.
Emerging Hubs in the Middle East, Africa, and Latin America
Emerging hubs show the biggest split between advanced clean-energy plans and basic infrastructure gaps. In the Middle East, Dubai is developing a solar park with a target capacity of 5,000 MW by 2030, backing a citywide goal of 75% clean energy by 2050. [7]
In Latin America, Medellín offers a strong example of city-scale climate work. Since 2016, it has built 30 interconnected green corridors along roads and waterways and planted 880,000 trees. By 2025, monitoring data showed temperature reductions of 2–3°C (3.6–5.4°F) and annual economic benefits of $7.8 million in energy and health savings. [8]
Across South America, firms put the most focus on renewable energy (54.1%) and waste reduction (39.3%). And 94.0% of mid-market firms plan to maintain or increase sustainability spending in 2026. [5]
Across Africa, the priorities are more basic: clean water (28.4%), renewable energy (48.5%), and the infrastructure needed to support both. Least-developed countries received only 4% of global urban climate finance in 2024, even though many of the world’s fastest-growing cities are located there. That gap helps explain why delivery often falls behind ambition. [5][8]
3 Sustainability Trends Showing Up Across Hubs in 2026
Across regions, the same three themes keep showing up: decarbonization, circular design, and social resilience. In both mature and fast-growing hubs, sustainability now shapes design choices, funding decisions, and the ability to keep talent. The bigger shift is pretty clear: sustainability is no longer sitting in a strategy deck. It's becoming part of how hubs actually run.
Decarbonization Is Moving From Pledges to District-Level Execution
Hubs are more and more being used as controlled test zones for clean power, electrified transport, and district cooling before those systems spread further. That focus makes sense. Buildings account for 37% of energy-related CO2 emissions globally, and transportation adds another 23% [8]. So when city leaders want cuts that matter, they tend to start at the district level, where both sectors can be tackled at once.
In early 2026, Berlin started turning Siemensstadt Square, a 76-hectare former factory site, into a mixed-use district built around AI-managed mobility and carbon-neutral energy systems [3]. Policy is also pushing this shift along. The EU's Energy Performance of Buildings Directive (EPBD) requires all new buildings to be zero-emission by 2030, and India is moving in the same direction through the Energy Conservation Building Code 2023 [8].
One stat says a lot here: a 2025 review found that fewer than 30% of sustainable city plans had secured implementation funding [8]. That's the gap many hubs are still dealing with. Big promises are common. District-scale delivery is harder. Right now, the edge goes to places that can get these systems built and running, not just announced. And that delivery mindset is starting to shape hub design from day one.
Circular Economy Models Are Being Built Into Hub Design
Circularity isn't being treated as a side project anymore. It's getting built into hubs from the start through district cooling networks, retrofit-first building rules, and updates to older industrial sites. Put simply, circularity is moving from an extra feature to a core design rule.
District energy systems show what that looks like on the ground. When hubs swap separate building HVAC systems for centralized networks, heating and cooling emissions can fall by 30% to 60% [8]. That's a big swing. And because most office space already exists, retrofitting now matters more than adding new buildings. In Europe, planning reviews are more often requiring retrofit-first studies before new construction gets approved.
In March 2026, Caterpillar put a $100 million upskilling and automation program into modernizing an existing U.S. facility instead of building new capacity, as part of a $725 million expansion [10]. That move says a lot. For many hubs, the question isn't "What can we build next?" It's "How do we get more out of what's already here?" At the same time, as hubs update physical systems, scrutiny is shifting toward who actually gains from those upgrades.
Social Resilience and Equity Are Now Core Performance Measures
The strongest 2026 research is looking past emissions totals alone. It asks whether the gains from a hub reach local residents, workers, and nearby neighborhoods.
In April 2026, Microsoft put in place a community-first plan for its data center developments. The plan includes covering the centers' electricity use, putting money into cooling efficiency to ease water stress, and offering tech-sector training for local residents [9]. That's the kind of move that used to get framed as public relations. Now it's more often treated as a scorecard item.
There's also a clear talent angle. Hubs that put housing affordability and quality of life near the top of the list have posted net migration rates of 5.2% over the last three years, beating established anchor cities [3]. For executives, that's not soft data. It's a hiring and retention signal. In early 2026, Seoul announced an $8.4 billion investment to build a 4.2-square-kilometer semiconductor community in Yongin, combining high-tech manufacturing with residential and community infrastructure [3]. Social resilience is starting to look less like a reporting box and more like a direct input into hub performance.
Reading the Evidence: What the Best 2026 Studies Measure and Where Gaps Remain
Once the trends come into focus, the next step is simple: figure out which claims can be compared on equal terms. For leaders deciding where to invest, partner, or expand, the issue isn't whether a hub says it's sustainable. It's whether the proof behind that claim lines up with the proof used somewhere else.
The Metrics Used Most Often Across Hub Studies
The strongest 2026 studies look at whether a plan is actually working. The metrics that show up most often are absolute emissions, or total CO2e; per-capita emissions; ecosystem value creation; climate-tech funding flows; and startup density in climate and AI-native sectors [2][12].
One of the most useful tests is whether emissions have peaked and are still moving down [12]. That's a tougher and more honest measure than a pledge or a far-off target year. Resilience, equity, and circularity now show up in more scorecards too, but reporting is still patchy. Only 33% of firms track Tier 2 supplier impacts, and the global circularity rate is still just 7.2% [1][11].
There's also a trap in growth data. When a hub grows fast, per-capita emissions can drop even while total emissions keep climbing. That's why the best studies track both numbers and test for actual decoupling between economic growth and carbon output [12].
The tougher problem, then, isn't what hubs say. It's how uneven the reporting still is.
Limits in Current Research and Why Comparisons Require Caution
Sustainability data across hubs is uneven, and that has direct consequences for executives making investment or partnership calls. Three problems show up again and again:
- Missing standards: Only about 40% of the 1,300+ cities reporting to CDP use the Global Protocol for Community-Scale Greenhouse Gas Inventories (GPC), which makes side-by-side comparison shaky [12].
- Slow reporting: Self-reported data often lags by two or more years, and only 1 in 5 cities worldwide publishes an annual GHG inventory using a standardized method [12].
- Scope 3 blind spots: Scope 3 makes up an average of 75% of a typical company's carbon footprint, yet fewer than half of reporting firms have set reduction targets for it [1]. If a hub leaves out embodied carbon in building materials or supply chain emissions, the headline figure can look much cleaner than the full picture [12][1].
These gaps matter because evidence quality varies a lot by hub type. So the table below works less like an academic exercise and more like a tool for capital allocation and site selection.
| Hub Type | Main Sustainability Strength | Common Constraint | Evidence Quality | Typical Time Horizon |
|---|---|---|---|---|
| Established Global Hubs | High climate-tech VC and mature disclosure [2] | High Scope 3 consumption emissions [12] | High (GPC-compliant) [12] | Long-term (2050 targets) |
| Asian Megacities | Rapid transport electrification and hardware innovation [12][2] | High industrial energy intensity [12] | Moderate (Rapidly improving) | Mid-term (2030–2060) |
| Emerging Middle East Hubs | Massive infrastructure investment and solar LCOE [4] | Extreme water stress and heat resilience [1] | Variable (Project-based) | Short-to-mid term |
| Midsize Growth Hubs | High per-capita reduction and affordability [4][12] | Limited grid control/national dependence [12] | High (Standardized) | Long-term |
Leaders should also check why emissions are falling. A drop driven by local policy tells one story. A drop driven by a cleaner national grid tells another. If you mix those together, hub comparisons can get misleading fast.
Conclusion: What These Trends Mean for Leadership and Competitive Advantage
The clearest takeaway from 2026 research is simple: the strongest hubs do the work. They don't just announce sustainability targets. They execute. And those trends - district decarbonization, circular design, and social resilience - are now separating leaders from laggards.
That shift changes what matters in site selection, investment, and partnership decisions. Data quality is now a key filter. Good data helps people compare hubs in a useful way. Weak data leads to bad calls. Only about 9% of assessed companies reached Yearbook membership in 2026, which shows how high the bar is for disclosure [13]. In plain English: leaders can't take claims at face value. They need to check the data underneath before making site selection, investment, or partnership decisions.
Past the numbers, the bigger split comes down to leadership across the ecosystem. As Seth Mattison frames it, AI compresses knowledge and expertise, so leadership advantage now depends on judgment, trust, and alignment. In global hubs, that means getting agencies, research partners, capital, and communities moving in the same direction so sustainability plans lead to actual performance. Competitive advantage now depends on how well leaders coordinate across networks - not how well they perform in isolation. That is the leadership work that now defines durable advantage.
FAQs
Which sustainability metrics matter most?
The most important metrics in 2026 are the ones that tie climate and resource work directly to business results and risk.
Companies are moving past simple carbon totals and putting more attention on Scope 3 emissions. That makes sense. For many companies, Scope 3 accounts for more than 70% of their total footprint.
Other key metrics include energy efficiency, circular economy performance, and measurable ESG impact. The metrics that matter most don’t just sit in a report. They show clear business value, like cost savings, less downtime, and better resource reuse.
Why are older buildings such a major challenge?
Older buildings are a tough nut to crack. Many were built long before today’s performance standards, so they often waste energy and fall short of what the market now expects.
That puts owners in a bind. Retrofits can cost a lot, utility grid limits can slow projects down, and split incentives make things even harder: tenants get the lower energy bills, while landlords are stuck paying the upfront costs.
On top of that, many aging buildings already need pricey upgrades just to stay competitive.
How should investors compare hubs with uneven data?
Think of location strategy as a portfolio design problem, not a simple optimization exercise. When the data is patchy or uneven, it helps to look at each hub from a few angles at once: policy friction, economic gravity, capability density, sovereignty constraints, and plain execution reality.
That matters because venture capital rankings and funding volume only tell part of the story. They can blur diversification and miss startup growth that’s happening outside the usual big-name centers. A market may look small on paper and still be the better fit for what you need.
So instead of leaning on one headline metric, compare micro-locations based on practical fit. Look at factors like:
- digital infrastructure
- sustainability integration
- alignment with regional regulatory goals
- alignment with local resilience goals
In plain English, the right choice isn’t always the place with the most money flowing through it. It’s often the place where your operating model, risk profile, and long-term goals line up best with local conditions.
Related Blog Posts

Seth Mattison
Top 50 Keynote Speakers in the World | Future of Work Strategist | Co-Founder & CEO